

Project Overview
ESP32 + ST7789 TFT Internet Weather Station: This project uses an ESP32 and a 240x240 ST7789 color TFT to fetch live conditions and a 5-day forecast from the OpenWeatherMap API, then draws the results on-screen over Wi-Fi.
No sensors and no calibration needed. The sketch pulls current temperature, humidity, and sky conditions for your city, then builds a five-day forecast from the 3-hour forecast data. It is a compact tour of ESP32 Wi-Fi, HTTP, JSON parsing, and graphics in one always-on display.
- Time: ~1 hour
- Skill level: Intermediate
- What you will build: A Wi-Fi weather display showing current conditions plus five daily highs/lows and sky descriptions, refreshed every ten minutes, using a free API key.

Parts List
From ShillehTek
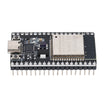
- ESP32 38-Pin Dev Board (CP2102, USB-C) - Wi-Fi microcontroller that runs the sketch and fetches the API data.
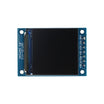
- 1.3" 240x240 ST7789 TFT - SPI color display used to render the live conditions and forecast.
- 830-Point Breadboard - Makes the SPI wiring easy to prototype.
- Dupont Jumper Wires - For connecting the TFT pins to the ESP32 GPIO pins.
External
- A free OpenWeatherMap account and API key (openweathermap.org → API keys)
Note: A brand-new OpenWeatherMap key can take up to a couple of hours to activate, so a 401 error right after signing up is normal. The free plan allows 60 calls a minute; this sketch makes two calls every ten minutes. Use the "2.5" endpoints shown here; the newer "One Call 3.0" API requires a card on file.
Step-by-Step Guide
Step 1 - Wire the TFT
Goal: Connect the ST7789 SPI display to the ESP32.
What to do: Wire ST7789 to ESP32 as follows: SCL → GPIO18, SDA → GPIO23, RES → GPIO4, DC → GPIO2, BLK → 3V3, VCC → 3V3, GND → GND (this 7-pin module has no CS pin).

Expected result: The display is wired and the backlight turns on when powered.
Step 2 - Configure TFT_eSPI
Goal: Configure the graphics library for the correct display and pin mapping.
What to do: Install TFT_eSPI using the Arduino Library Manager. Open its User_Setup.h and set: #define ST7789_DRIVER, TFT_WIDTH 240, TFT_HEIGHT 240, TFT_MOSI 23, TFT_SCLK 18, TFT_CS -1, TFT_DC 2, TFT_RST 4, and enable LOAD_FONT2 and LOAD_FONT4. Also install ArduinoJson (version 7). If colors look inverted later, add #define TFT_INVERSION_ON.
Expected result: TFT_eSPI matches your ST7789 and your ESP32 wiring.
Step 3 - Upload the sketch
Goal: Build and run the weather station code on your ESP32.
What to do: Paste the sketch below into the Arduino IDE. Fill in your Wi-Fi credentials, OpenWeatherMap API key, and your city in the City,CountryCode format (example: Boston,US). Then compile and upload.
Code:
#include <WiFi.h>
#include <HTTPClient.h>
#include <ArduinoJson.h>
#include <TFT_eSPI.h>
TFT_eSPI tft;

const char* SSID = "YourNetwork";
const char* PASS = "YourPassword";
const char* KEY  = "your_openweathermap_api_key";
const char* CITY = "Boston,US";                     // "City,CountryCode"

struct Day { long day; float lo, hi; String cond; };
Day days[6]; int nDays = 0;
float nowT = 0, nowH = 0; String nowCond = "--"; long tzOff = 0;
const char* WD[] = {"Sun","Mon","Tue","Wed","Thu","Fri","Sat"};

bool getJson(const String& url, JsonDocument& doc, JsonDocument* filter = nullptr) {
  HTTPClient http; http.useHTTP10(true);            // plain HTTP/1.0 so we can parse the stream
  http.begin(url);
  if (http.GET() != 200) { http.end(); return false; }
  DeserializationError e = filter
      ? deserializeJson(doc, http.getStream(), DeserializationOption::Filter(*filter))
      : deserializeJson(doc, http.getStream());
  http.end();
  return !e;
}

void fetchWeather() {
  String base = "http://api.openweathermap.org/data/2.5/";
  String tail = String("?q=") + CITY + "&units=metric&appid=" + KEY;
  JsonDocument doc;

  if (getJson(base + "weather" + tail, doc)) {      // current conditions
    nowT = doc["main"]["temp"]; nowH = doc["main"]["humidity"];
    nowCond = doc["weather"][0]["main"].as<String>();
    tzOff = doc["timezone"];                        // seconds east of UTC
  }

  JsonDocument filter;                              // keep only what we need from ~16 KB of JSON
  filter["list"][0]["dt"] = true;
  filter["list"][0]["main"]["temp_min"] = true;
  filter["list"][0]["main"]["temp_max"] = true;
  filter["list"][0]["weather"][0]["main"] = true;
  doc.clear();
  if (getJson(base + "forecast" + tail, doc, &filter)) {   // 40 x 3-hour slots
    nDays = 0;
    for (JsonObject it : doc["list"].as<JsonArray>()) {
      long local = it["dt"].as<long>() + tzOff;
      long d = local / 86400, hour = (local % 86400) / 3600;
      float lo = it["main"]["temp_min"], hi = it["main"]["temp_max"];
      String c = it["weather"][0]["main"].as<String>();
      if (nDays == 0 || days[nDays - 1].day != d) {
        if (nDays == 6) break;
        days[nDays++] = { d, lo, hi, c };           // new calendar day
      }
      Day& D = days[nDays - 1];
      D.lo = min(D.lo, lo); D.hi = max(D.hi, hi);
      if (hour >= 12 && hour < 15) D.cond = c;         // midday slot describes the day
    }
  }
}

void draw() {
  tft.fillScreen(TFT_BLACK);
  tft.setTextColor(TFT_WHITE, TFT_BLACK); tft.drawString(CITY, 6, 4, 2);
  tft.setTextColor(TFT_CYAN,  TFT_BLACK); tft.drawString(String(nowT, 1) + " C", 6, 22, 4);
  tft.setTextColor(TFT_WHITE, TFT_BLACK);
  tft.drawString(nowCond + "  " + String((int)nowH) + "% RH", 6, 52, 2);
  tft.drawFastHLine(0, 74, 240, TFT_DARKGREY);
  int start = (nDays > 5) ? 1 : 0;                  // skip today's partial day if we have 6
  for (int i = 0; i < 5 && start + i < nDays; i++) {
    Day& D = days[start + i]; int y = 82 + i * 30;
    tft.setTextColor(TFT_YELLOW, TFT_BLACK); tft.drawString(WD[(D.day + 4) % 7], 6, y, 2);
    tft.setTextColor(TFT_WHITE,  TFT_BLACK);
    tft.drawString(String((int)round(D.lo)) + "/" + String((int)round(D.hi)) + " C", 56, y, 2);
    tft.setTextColor(TFT_GREENYELLOW, TFT_BLACK); tft.drawString(D.cond, 140, y, 2);
  }
}

void setup() {
  Serial.begin(115200);
  tft.init(); tft.setRotation(0); tft.fillScreen(TFT_BLACK);
  tft.drawString("Connecting...", 6, 4, 2);
  WiFi.begin(SSID, PASS);
  while (WiFi.status() != WL_CONNECTED) delay(250);
  fetchWeather(); draw();
}

void loop() {
  static unsigned long last = 0;
  if (millis() - last >= 600000UL) { last = millis(); fetchWeather(); draw(); }   // every 10 min
}
Expected result: After a few seconds, the screen shows your city, the current temperature in large cyan digits, the sky condition and humidity, then five rows with weekday, low/high, and condition. It refreshes every ten minutes.
Step 4 - Understand how the forecast is built
Goal: Understand how the 5-day forecast rows are computed from OpenWeatherMap data.
What to do: The free forecast endpoint returns 40 time slots, one every three hours. The sketch shifts each timestamp into local time using the city timezone offset, groups slots by calendar day, keeps the lowest low and highest high, and uses the midday slot condition to describe the day. The ArduinoJson filter makes this fit on a microcontroller by parsing only the needed fields from the stream instead of loading the full JSON payload.
Expected result: You can change what is shown by adding fields to the filter and expanding the data struct (for example wind, rain probability "pop", or sunrise).
Step 5 - Customize the display
Goal: Adapt the demo into a long-term desk or shelf display.
What to do: Change units=metric to imperial for Fahrenheit. Use the forecast "icon" field to draw weather glyphs (TFT_eSPI can display small bitmaps). Add a light sleep between refreshes to run from a battery. For multiple cities, call fetchWeather() with a second CITY and alternate screens on a timer.
Expected result: A weather station that never needs a sensor, a window, or calibration.
Conclusion
With an ESP32, an ST7789 TFT, and two OpenWeatherMap API calls, you can fetch live conditions, filter JSON down to just what you need, and render a readable 5-day forecast that updates every ten minutes.
Want the exact parts used in this build? Grab them from ShillehTek.com. If you want help customizing this project or building something similar for your product, check out our IoT consulting services.
Credits: All photos and images in this tutorial are credited to Mirko Pavleski (mircemk) on Hackster.io. The original guide by Mirko Pavleski served as the reference for this ShillehTek version.


.png?v=25000753014097803521789896137)

.png?v=68677308723310773341789896137)


