

Project Overview
Arduino Nano OLED Oscilloscope: This project uses an Arduino Nano and a 0.96 inch I2C OLED (SSD1306) to build a single-channel mini oscilloscope that can display waveforms up to about 30 kHz with a software trigger, plus Vpp and frequency readout.
A real oscilloscope is the best debugging tool there is, and a surprisingly useful one fits on a breadboard. The ADC is sped up to about 75,000 samples per second, a software trigger locks the trace so repeating signals stand still, three buttons set the timebase and hold the display, and the top line shows peak-to-peak voltage and frequency. It will not replace a bench scope, but it will show you PWM, serial bursts, sensor ripple and audio in a way a multimeter never can.
- Time: ~1 hour
- Skill level: Intermediate
- What you will build: A 0 to 5 V single-channel oscilloscope with seven timebases (about 0.2 ms to 80 ms per screen), rising-edge trigger, hold, and automatic Vpp/frequency measurement.

Parts List
From ShillehTek
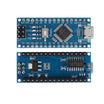
- Arduino Nano V3.0 Pre-Soldered - the microcontroller running the fast ADC capture and display code
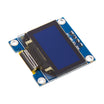
- 0.96 inch I2C OLED (SSD1306) - shows the waveform and measurements (the original used a 128x64 ST7920 LCD)
- Tactile Button Kit x3 - faster, slower, and hold controls
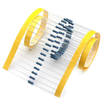
- Resistor Kit - 10k ohm series input resistor, plus 2x100k ohm for optional AC coupling bias
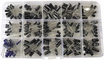
- Electrolytic Capacitor Kit - 1 uF for optional AC coupling
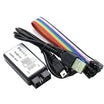
- 24 MHz Logic Analyzer - helpful companion for decoding digital buses this analog scope cannot
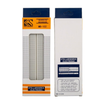
- 830-Point Breadboard - quick prototyping for the build
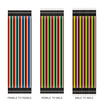
- Dupont Jumper Wires - makes wiring the OLED, buttons, and input fast
External
- Two 1N4148 diodes for input clamping, and a pair of probe leads
Note: this is a 0 to 5 V instrument. The clamp diodes and 10k ohm series resistor protect the pin from brief over-voltage, but never probe mains, motor supplies or anything above about 12 V. For higher voltages add a 10:1 divider (90k ohm + 10k ohm) and multiply the readout by ten.
Step-by-Step Guide
Step 1 - Wire the Input, Buttons and Display
Goal: A protected probe input and three controls.
What to do: Probe tip to 10k ohm to A0. Clamps at A0: 1N4148 from A0 to 5V (cathode/band to 5V) and 1N4148 from GND to A0 (band to A0). Probe ground to GND.
Buttons: D8 (faster), D9 (slower), D10 (hold) each to GND. OLED: SDA to A4, SCL to A5, VCC to 5V, GND to GND.

Expected result: An input that can survive a careless probe.
Step 2 - Upload the Sketch
Goal: Get the oscilloscope running on the OLED with Vpp and frequency readout.
What to do: Install the Adafruit GFX and Adafruit SSD1306 libraries, then compile and upload the sketch below. After upload, touch the probe to D5. The sketch outputs a built-in test signal there (about a 980 Hz square wave).
Code:
#include <Adafruit_GFX.h>
#include <Adafruit_SSD1306.h>
Adafruit_SSD1306 oled(128, 64, &Wire, -1);

const int BTN_FAST = 8, BTN_SLOW = 9, BTN_HOLD = 10;
const int N = 128;                       // one sample per pixel column
uint8_t buf[N];
// microseconds per sample for each timebase, and the ADC prescaler that gives it
const unsigned int STEP_US[7] = {13, 26, 52, 104, 250, 1000, 5000};
const uint8_t      PRESC[7]   = {4,  5,  6,  7,   7,   7,    7};     // 16, 32, 64, 128 ...
int tb = 3; bool hold = false;
float vpp = 0, freq = 0;

inline uint8_t sample() {                // 8-bit read, left-adjusted result in ADCH
  ADCSRA |= (1 << ADSC); while (ADCSRA & (1 << ADSC)); return ADCH;
}

void capture() {
  ADCSRA = (1 << ADEN) | PRESC[tb];       // ADC on, speed set by the timebase
  bool armed = false; unsigned long t0 = micros();
  while (micros() - t0 < 20000) {         // trigger: rising edge through mid-scale, 20 ms timeout
    uint8_t v = sample();
    if (v < 110) armed = true;
    else if (armed && v >= 128) break;
  }
  for (int i = 0; i < N; i++) {
    if (tb < 4) buf[i] = sample();                          // fast ranges: as quick as the ADC allows
    else { unsigned long t = micros(); buf[i] = sample(); while (micros() - t < STEP_US[tb]) {} }
  }
}

void measure() {
  uint8_t lo = 255, hi = 0; int crossings = 0, first = -1, last = -1; bool below = buf[0] < 118;
  for (int i = 0; i < N; i++) {
    lo = min(lo, buf[i]); hi = max(hi, buf[i]);
    if (below && buf[i] >= 138) { below = false; crossings++; if (first < 0) first = i; last = i; }
    else if (!below && buf[i] < 118) below = true;
  }
  vpp = (hi - lo) * 5.0 / 255.0;
  float span = (last - first) * (STEP_US[tb] * 1e-6);            // seconds between first and last edge
  freq = (crossings >= 2) ? (crossings - 1) / span : 0;
}

void draw() {
  oled.clearDisplay();
  oled.setCursor(0, 0);
  oled.print((unsigned long)STEP_US[tb] * 16); oled.print("us ");   // per 16-pixel division
  oled.print(vpp, 2); oled.print("V ");
  if (freq >= 1000) { oled.print(freq / 1000, 1); oled.print("kHz"); }
  else              { oled.print(freq, 0);        oled.print("Hz"); }
  if (hold) oled.print(" H");
  for (int x = 0; x < 128; x += 16) for (int y = 12; y < 64; y += 4) oled.drawPixel(x, y, SSD1306_WHITE);   // grid
  for (int i = 1; i < N; i++)
    oled.drawLine(i - 1, 63 - buf[i - 1] * 51 / 255, i, 63 - buf[i] * 51 / 255, SSD1306_WHITE);
  oled.display();
}

void setup() {
  pinMode(BTN_FAST, INPUT_PULLUP); pinMode(BTN_SLOW, INPUT_PULLUP); pinMode(BTN_HOLD, INPUT_PULLUP);
  oled.begin(SSD1306_SWITCHCAPVCC, 0x3C); oled.setTextColor(SSD1306_WHITE);
  ADMUX = (1 << REFS0) | (1 << ADLAR);    // AVcc reference, left-adjust, channel A0
  analogWrite(5, 128);                    // built-in test signal: 980 Hz square wave on D5
}

void loop() {
  if (!digitalRead(BTN_FAST) && tb > 0) { tb--; delay(200); }
  if (!digitalRead(BTN_SLOW) && tb < 6) { tb++; delay(200); }
  if (!digitalRead(BTN_HOLD)) { hold = !hold; delay(300); }
  if (!hold) { capture(); measure(); }
  draw();
}
Expected result: A steady square wave on the screen with something like "1664us 4.96V 980Hz" along the top. Press D8/D9 to zoom the timebase in and out, and press D10 to freeze the trace.
Step 3 - Understand How the Speed and Trigger Work
Goal: Know what is under the hood.
What to do: analogRead() takes about 112 us. This sketch talks to the ADC registers directly, keeps only the top 8 bits (ADLAR) and drops the clock prescaler to 16, which brings one sample down to about 13 us (about 75 ksps). The trigger loop waits for the signal to dip below mid-scale and then cross above it, so every capture starts at the same point of the waveform and a repeating signal appears frozen.
The frequency readout counts those crossings across the buffer, so it is only valid when at least two full cycles fit on screen. Zoom out if it reads 0.
Expected result: You can explain every number on the display.
Step 4 - Add AC Coupling (Optional)
Goal: View audio and signals that swing below ground.
What to do: Put the 1 uF capacitor in series with the probe tip (before the 10k ohm), and add a bias divider at A0: 100k ohm from A0 to 5V and 100k ohm from A0 to GND. The trace now sits at mid-screen and shows the AC part of the signal, like a headphone output, ripple on a power rail, or a microphone module output.
Expected result: Music from a phone jack draws itself across the OLED.
Step 5 - Use It
Goal: Do real debugging with the scope.
What to do: Look at PWM from a motor driver (is it the duty cycle you set?), the output of an LM35 or a potentiometer (is it noisy?), the 38 kHz burst from an IR remote via a receiver module, or the ripple on a buck converter output.
For digital buses (I2C, SPI, serial), use a logic analyzer instead. It captures eight channels at 24 MHz and decodes the protocol, which this scope cannot.
Expected result: Fewer guesses, more looking.
Conclusion
Direct ADC control, a software trigger and a small amount of drawing code turn an Arduino Nano into a pocket oscilloscope. It is limited, but it is limited in ways you can measure and understand. It is a practical tool for quickly seeing what signals in your projects are really doing.
Photo and reference credit: Mirko Pavleski (mircemk) on Hackster.io.
Want the exact parts used in this build? Grab them from ShillehTek.com. If you want help customizing this project or building something for your product, check out our IoT consulting services.


.png?v=25000753014097803521791168436)

.png?v=68677308723310773341791168436)


