

Project Overview
ESP32 + BME280: In this project, you stream BME280 temperature, humidity, and pressure readings from an ESP32 over WebSocket into Node-RED, store them in InfluxDB, and visualize everything in Grafana as a live dashboard with alerts.
Serial plots and phone apps are fine for a demo. When you want to see last Tuesday's humidity, compare three rooms over a month, or get a message when the server cupboard passes 30 C, you want the stack that industry uses: a time-series database and a dashboard tool.
This guide builds the stack on a Raspberry Pi (or any computer with Docker): an ESP32 with a BME280 holds a WebSocket open to Node-RED and sends a reading every five seconds; Node-RED shapes it and writes it to InfluxDB; Grafana turns the database into live graphs, gauges, and alerts. Each piece does one job, each is free, and the whole thing starts with one command.
- Time: ~1.5 hours
- Skill level: Intermediate
- What you will build: An ESP32 WebSocket sensor, a Docker Compose stack of Node-RED + InfluxDB 2 + Grafana, a Node-RED flow that tags and stores readings, and a Grafana dashboard with an alert rule.

Parts List
From ShillehTek
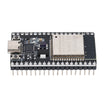
- ESP32 Dev Board (38-pin, CP2102, USB-C) - runs the Wi-Fi + WebSocket client and reads the sensor over I2C
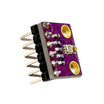
- BME280 Temperature / Humidity / Pressure Sensor - provides the environmental readings to log and graph
- 400-Point Breadboard - quick prototyping for the ESP32 and sensor wiring
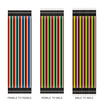
- Dupont Jumper Wires - connects the BME280 to the ESP32 I2C pins
External
- A Raspberry Pi 4/5 with a 64-bit OS (or any always-on Linux, Mac, or Windows machine) with Docker and Docker Compose installed
Note: The passwords and token in the compose file below are placeholders. Change them before the first start (InfluxDB setup mode only runs once, on an empty volume) and do not expose ports 1880, 8086, or 3000 to the internet without putting authentication or a VPN in front.
Step-by-Step Guide
Step 1 - Start the Stack
Goal: Start Node-RED, InfluxDB 2, and Grafana as a single Docker Compose stack.
What to do: Save the following as docker-compose.yml in an empty folder on the Pi (or your Docker host). Edit the password and token first, then run docker compose up -d.
# docker-compose.yml
services:
  nodered:
    image: nodered/node-red:latest
    ports: ["1880:1880"]
    volumes: ["nodered:/data"]
    restart: unless-stopped
  influxdb:
    image: influxdb:2.7
    ports: ["8086:8086"]
    volumes: ["influx:/var/lib/influxdb2"]
    environment:
      DOCKER_INFLUXDB_INIT_MODE: setup
      DOCKER_INFLUXDB_INIT_USERNAME: admin
      DOCKER_INFLUXDB_INIT_PASSWORD: change-this-password
      DOCKER_INFLUXDB_INIT_ORG: home
      DOCKER_INFLUXDB_INIT_BUCKET: sensors
      DOCKER_INFLUXDB_INIT_ADMIN_TOKEN: change-this-long-random-token
    restart: unless-stopped
  grafana:
    image: grafana/grafana:latest
    ports: ["3000:3000"]
    volumes: ["grafana:/var/lib/grafana"]
    restart: unless-stopped
volumes:
  nodered:
  influx:
  grafana:
Expected result: Three services running: Node-RED on http://<pi>:1880, InfluxDB on :8086 (log in as admin to check the sensors bucket exists), and Grafana on :3000 (admin / admin, then it asks for a new password).
Step 2 - The Node-RED Flow
Goal: Accept WebSocket sensor JSON, shape it for InfluxDB, and write it to the bucket.
What to do: In Node-RED: menu - Manage palette - Install node-red-contrib-influxdb. Build the flow websocket in - json - function (paste the code below) - influxdb out. Set the websocket node to "Listen on" path /ws/sensors. In the influxdb out node, add a server with version 2.0, URL http://influxdb:8086 (the container name works inside the Compose network) and the token from the compose file; set organisation home and bucket sensors. Add a debug node after the json node, then Deploy.
Code:
// Function node "shape for InfluxDB"
// in:  msg.payload = {"device":"esp32-lab","t":23.41,"h":51.2,"p":1012.6}
const d = msg.payload;
msg.measurement = "environment";
msg.payload = [
  { temperature: d.t, humidity: d.h, pressure: d.p },   // fields: the numbers you graph
  { device: d.device }                                  // tags: what you filter and group by
];
return msg;
Expected result: A deployed flow waiting for its first client.
Step 3 - Wire the ESP32
Goal: Connect one BME280 sensor to the ESP32 over I2C.
What to do: Wire the BME280 as follows: VCC - 3V3, GND - GND, SDA - GPIO21, SCL - GPIO22. Install ArduinoWebsockets (Gil Maimon) and Adafruit BME280 from the Arduino Library Manager.
Expected result: Four wires connected and both libraries installed.
Step 4 - The ESP32 Sketch
Goal: Read the BME280 and send JSON to Node-RED over a persistent WebSocket connection every 5 seconds.
What to do: Set your Wi-Fi SSID/password, set the Pi (Node-RED host) IP in WS_URL, choose a device name, then upload the sketch.
Code:
#include <WiFi.h>
#include <ArduinoWebsockets.h>
#include <Wire.h>
#include <Adafruit_BME280.h>

using namespace websockets;
const char* SSID   = "YourNetwork";
const char* PASS   = "YourPassword";
const char* WS_URL = "ws://192.168.1.20:1880/ws/sensors";   // the Pi running Node-RED
const char* DEVICE = "esp32-lab";                           // becomes the InfluxDB tag

WebsocketsClient ws;
Adafruit_BME280 bme;

void connectWs() {
  while (!ws.connect(WS_URL)) { Serial.println("WebSocket retry..."); delay(2000); }
  Serial.println("WebSocket connected");
}

void setup() {
  Serial.begin(115200);
  Wire.begin(21, 22);
  if (!bme.begin(0x76)) Serial.println("BME280 not found - try 0x77");
  WiFi.begin(SSID, PASS);
  while (WiFi.status() != WL_CONNECTED) delay(250);
  connectWs();
}

void loop() {
  static unsigned long last = 0;
  ws.poll();                                       // services the connection
  if (!ws.available()) connectWs();                // Node-RED restarted? reconnect
  if (millis() - last >= 5000) {
    last = millis();
    char msg[128];
    snprintf(msg, sizeof msg, "{\"device\":\"%s\",\"t\":%.2f,\"h\":%.1f,\"p\":%.1f}",
             DEVICE, bme.readTemperature(), bme.readHumidity(), bme.readPressure() / 100.0);
    ws.send(msg);
    Serial.println(msg);
  }
}
Expected result: You see "WebSocket connected", then a JSON line every five seconds and the same objects appearing in Node-RED's debug sidebar. In InfluxDB's Data Explorer, the environment measurement now has temperature, humidity, and pressure fields.
Step 5 - Build the Grafana Dashboard
Goal: Connect Grafana to InfluxDB and graph the ESP32 measurements.
What to do: In Grafana: Connections - Data sources - Add - InfluxDB. Choose query language Flux, URL http://influxdb:8086, organisation home, the token, default bucket sensors; Save & test. Create a dashboard, add a Time series panel, paste the query below, and set the unit to Celsius. Duplicate the panel for humidity and pressure (change _field), add a Gauge panel with last() instead of aggregateWindow for the current value, and set the dashboard to refresh every 5 s.
Code:
// Flux query for a Grafana time-series panel
from(bucket: "sensors")
  |> range(start: v.timeRangeStart, stop: v.timeRangeStop)
  |> filter(fn: (r) => r._measurement == "environment" and r._field == "temperature")
  |> aggregateWindow(every: v.windowPeriod, fn: mean, createEmpty: false)
  |> yield(name: "mean")
Expected result: Live lines that fill in every five seconds, and history you can zoom back through by days or months. aggregateWindow keeps long ranges fast by averaging to the screen's resolution.
Step 6 - Alerts, More Devices and Retention
Goal: Turn the dashboard into a monitoring system and scale to multiple ESP32 devices.
What to do: In Grafana, Alerting - Alert rules - New: query the temperature, condition "last value above 30", evaluate every minute for 5 minutes, and send to a contact point (email, Telegram, Discord, and Slack are built in). Flash the same sketch to more ESP32s with different DEVICE names. The tag lets one panel draw every room with group(columns: ["device"]) or a dashboard variable. In InfluxDB, set the bucket's retention (for example 90 days) and add a downsampling task that keeps hourly means forever. Because Node-RED sits in the middle, the same readings can also go to MQTT, Home Assistant, or a CSV export with one more wire.
Expected result: A small, real monitoring platform using the same basic architecture used for factories and server rooms.
Conclusion
The ESP32 measures, Node-RED routes, InfluxDB remembers, and Grafana explains. Four tools, each doing one thing well, connected by a WebSocket and a single compose file.
Once one sensor is flowing, every new device is a copy of the sketch with a different name, and every new question about your data is a new panel.
Want the exact parts used in this build? Grab them from ShillehTek.com. If you want help customizing this project or building something for your product, check out our IoT consulting services.
Credits
All photos and images in this tutorial are credited to WGLabz on Hackster.io (MIT license). The original guide by WGLabz served as the reference for this ShillehTek version. We thank them for their excellent work in the maker community.


.png?v=25000753014097803521791168436)

.png?v=68677308723310773341791168436)


