- Raspberry Pi Pico W
- BME280 sensor from ShillehTek
- Jumper wires
- Breadboard
- A computer with Thonny IDE installed
- Wi-Fi network credentials
- ThingSpeak account
Before we get into the remainder, consider subscribing or supporting the channel. Also, be sure to checkout our various stores to shop products for Raspberry Pi, Arduino, ESP32, and DIY electronics at ShillehTek!
Subscribe:
Support:
https://www.buymeacoffee.com/mmshilleh
Hire me at UpWork to build your IoT projects:
https://www.upwork.com/freelancers/~017060e77e9d8a1157
Visit ShillehTek Store for Arduino and Raspberry Pi Sensors and Pre-SolderedComponents:
ShillehTek Website (Exclusive Discounts):
https://shillehtek.com/collections/all
ShillehTekAmazon Store:
ShillehTek Amazon Store - Canada
ShillehTek Amazon Store - Japan
Step 1-) Setting Up ThingSpeak
- Create a ThingSpeak Account: If you don't have one, sign up for a ThingSpeak account at thingspeak.com.
-
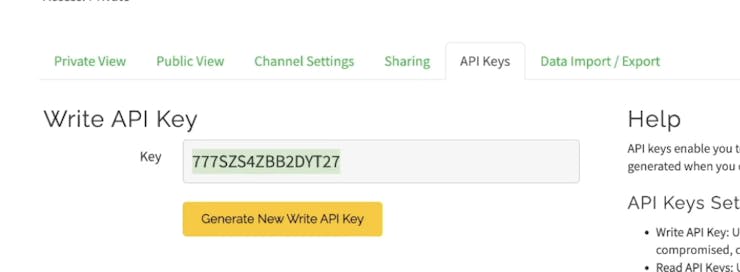
Create a New Channel:Go to the Channels tab and click "New Channel".Name your channel (e.g., "Pico W Weather Station").Add three fields: Temperature, Pressure, and Humidity.Save the channel and note down the
Write API Key. You can get it in the API Keys tab.
Creating Visualizations -
Numeric Display for Temperature:
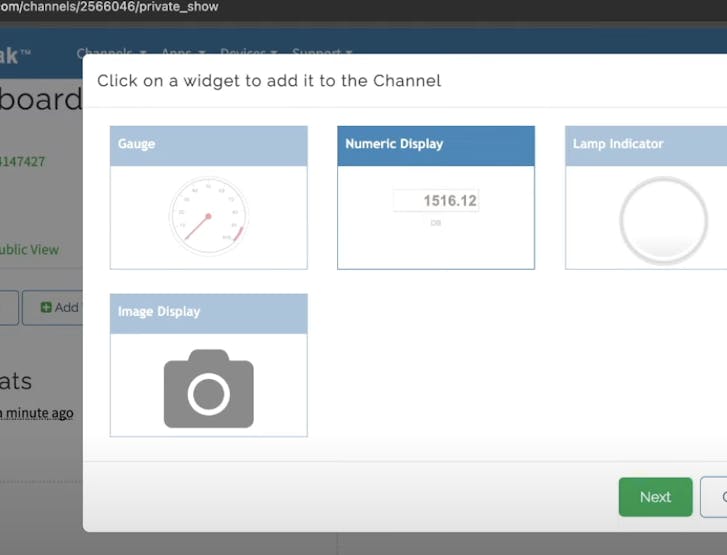
- Go to your channel view and click on the "Add Widget" button.
- Select "Numeric Display" from the widget options.
- Choose the field corresponding to Temperature.
- Save the widget to add it to your channel dashboard.
Graph for Pressure:
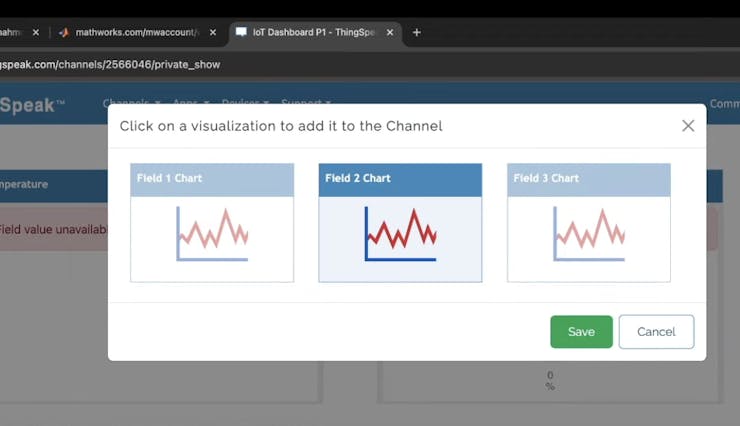
- Click on the "Add Visualizations" button.
- Choose the field corresponding to Pressure.
- Configure the time span and any other settings you prefer.
- Save the widget to add it to your channel dashboard.
Gauge for Humidity:
- Click on the "Add Widget" button.
- Select "Gauge" from the widget options.
- Choose the field corresponding to Humidity.
- Configure the gauge with appropriate min and max values (e.g., 0 to 100%).
- Save the widget to add it to your channel dashboard.
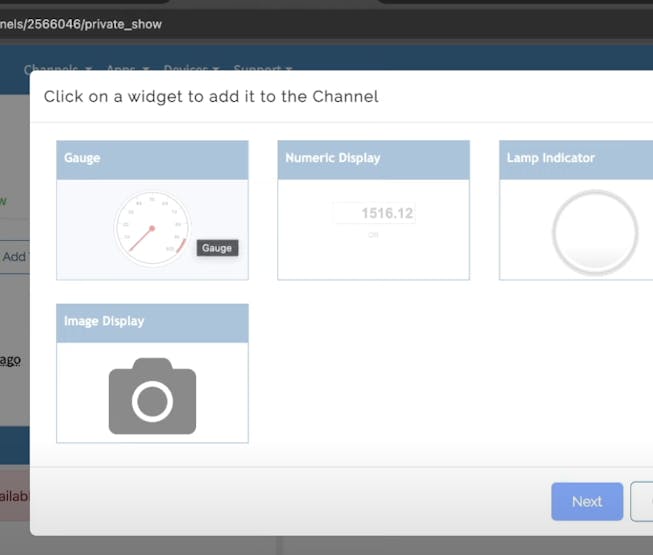
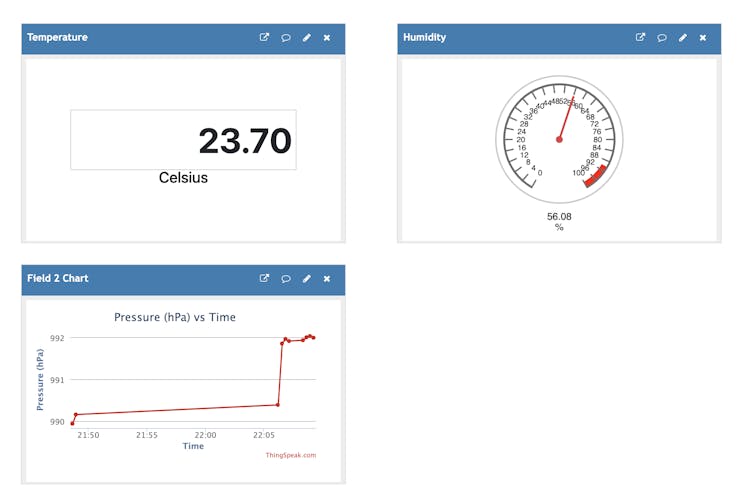
Now that you have all of this, you have the basis of what you need to start populating and visualizing the sensor data from the ShillehTek BME280 in ThingSpeak. If you are using another sensor, you can play around with other widgets and visualizations as needed, the interface is fairly straightforward.
Step 2-) MicroPython Code
Here's the full code to read data from the BME280 sensor and send it to ThingSpeak:
GitHub CodeCode Walkthrough
-
Import Libraries: We import necessary libraries including
networkfor Wi-Fi connectivity,urequestsfor HTTP requests, andbme280for sensor interaction. - Initialize I2C: Set up I2C communication with the BME280 sensor.
- Connect to Wi-Fi: Use your Wi-Fi credentials to connect the Pico W to the internet.
-
Read Sensor Data: Define a function
read_sensorto get temperature, pressure, and humidity readings from the BME280 sensor. - Send Data to ThingSpeak: In an infinite loop, read data from the sensor and send it to ThingSpeak every 15 seconds.
If you are using the BME280 library, you need to modify the return values by removing all suffixes (e.g., 'C', 'hPa', '%') so that the data is interpretable by the IoT platform. Additionally, if you are using an earlier version of MicroPython, make sure you install urequests, as it may not come pre-installed with some versions.
You also have the option to hardcode your Wi-Fi credentials directly into the code instead of using a constants file. Simply replace the placeholders with your actual Wi-Fi SSID and password.
Once your script is running, you should see your ThingSpeak dashboard updating in real-time! This setup can be further customized to suit your specific needs. Additionally, ThingSpeak offers various other data integration and visualization options to explore.
Conclusion
Congratulations! You have successfully set up your Raspberry Pi Pico W to send sensor data to ThingSpeak. This setup allows you to monitor environmental conditions in real-time from anywhere. ThingSpeak provides powerful tools for data analysis and visualization, making it an excellent choice for IoT projects. Happy tinkering! Also, do not forget to subscribe if you have not!
