

Project Overview
ESP32 IoT Weather Station: Use an ESP32 with a DHT22, BMP180, and SI1145 sunlight sensor to stream six live weather parameters over WiFi to Blynk, complete with web and mobile dashboards and history charts.
The hardware is simple, but the result is a genuinely useful always-on station and a solid introduction to end-to-end IoT.
- Time: An afternoon (most of it is the dashboard setup)
- Skill level: Beginner to Intermediate
- What you will build: A six-parameter weather station with live web and mobile dashboards plus historical charts.


Parts List
From ShillehTek
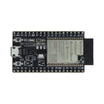
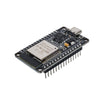
- ESP32-DevKitC-VE Pre-Soldered Dev Board - main microcontroller running WiFi + Blynk (any ESP32 DevKit works, for example the ESP-WROOM-32 USB-C board)
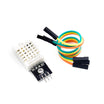
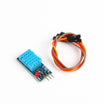
- DHT22 Temperature & Humidity Sensor - measures temperature and humidity (or the DHT11; one line of code selects it)
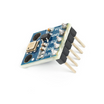
- BMP180 Pre-Soldered Barometric Pressure Sensor - measures barometric pressure over I2C
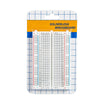
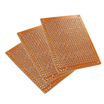
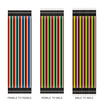
- Breadboard or prototype PCB, jumper wires, and a micro USB cable - for prototyping and powering/programming the ESP32
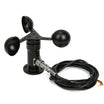
- Wind speed anemometer (optional) - expansion sensor idea using additional inputs and virtual pins
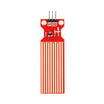
- Rain sensor (optional) - expansion sensor idea for precipitation detection
External
- SI1145 sunlight sensor (UV/IR/visible; Grove or breakout version) - or skip it and run a temperature/humidity/pressure station with just the parts above
- Free Blynk account
Note: The DHT talks on one digital pin, while the BMP180 and SI1145 share the I2C bus. That is why three sensors need only three signal wires.
Step-by-Step Guide
Step 1 - Wire the Three Sensors
Goal: Connect all sensors to the ESP32.
What to do: Power every sensor from Vin and GND, then connect the signal lines like this:
DHT:     SIG -> D5               (one digital pin)
BMP180:  SDA -> D21, SCL -> D22  (I2C)
SI1145:  SDA -> D21, SCL -> D22  (same I2C bus)
A tidy option is to solder a mini shield with parallel male headers for the busiest pins (Vin, GND, D21, D22) so all three sensors plug in cleanly.


Expected result: A clean, compact sensor cluster connected to the ESP32.
Step 2 - Set Up the IDE for ESP32
Goal: Install ESP32 board support and required libraries.
What to do: Add the Espressif boards URL (https://raw.githubusercontent.com/espressif/arduino-esp32/gh-pages/package_esp32_index.json) in Preferences, install "ESP32 by Espressif Systems" from the Boards Manager, then install four libraries from the Library Manager: Blynk (Volodymyr Shymanskyy), DHT Sensor Library (Adafruit), Grove Barometer Sensor (Seeed), and Grove Sunlight Sensor (Seeed). Download the project sketch from the original write-up (linked below in the conclusion credit).


Expected result: The sketch compiles.
Step 3 - Create Your Blynk Template
Goal: Create the cloud template for the station.
What to do: Sign up at blynk.io, then create a New Template named "Weather Station" with Hardware = ESP32 and Connection = WiFi. Blynk assigns it a unique Template ID.


Expected result: A template with its ID ready.
Step 4 - Create Six Datastreams
Goal: Assign one virtual pin per measurement.
What to do: Under Datastreams, add six Virtual Pin streams, all Data Type "Double" with two decimals (#.##): Temperature on V0 (°C, 0-100), Humidity on V1 (%, 0-100), Pressure on V2 (0-2000), Visible Light on V3, IR Radiation on V4, and UV Index on V5 (each 0-300). Save.

Expected result: Six datastreams saved.
Step 5 - Build the Web Dashboard
Goal: Create labels for live values and charts for history.
What to do: Drag six Label widgets onto the dashboard and bind each to its datastream (the gear icon opens settings; you can color-code by value and show level bars). Then add six Chart widgets, one per stream (the free tier shows one datastream per chart), choose line/area/column styles, and enable autoscale. Save.


Expected result: A dashboard showing (for now) sample data.
Step 6 - Create the Device and Copy Credentials
Goal: Link your hardware device to the Blynk cloud.
What to do: Create a New Device from your template. Blynk shows three credentials: Template ID, Device Name, and Auth Token. Paste them into the sketch's BLYNK_TEMPLATE_ID, BLYNK_DEVICE_NAME, and auth[] defines, and fill in your WiFi ssid[] and pass[]. If you are using a DHT11 or DHT21 instead of a DHT22, uncomment the matching #define DHTTYPE line.


Expected result: A sketch personalized for your device and network.
Step 7 - Upload and Verify
Goal: Get the station online and publishing real sensor data.
What to do: Select your ESP32 board and COM port, click Upload, and hold the BOOT button when "connecting..." appears. Then open the serial monitor at 115200 and press reset; the Blynk logo appears when WiFi connects. Your Blynk device flips to Online and real values replace the sample data.
If it does not work, check systematically: wrong credentials means no connection, wrong datastream binding means wrong widget values, and sensor issues can be isolated by testing each sensor with its example sketch.


Expected result: Hours-long chart history without a hiccup (the reference build ran for 6+ hours cleanly).
Step 8 - Add the Mobile Dashboard (Optional)
Goal: View the weather station on your phone.
What to do: Install the Blynk IoT app and log in; your device syncs automatically. Build the phone layout with six Labeled Value widgets (you can append units like °C and %) plus SuperCharts with selectable history ranges (15 minutes to hours).

Expected result: Live weather anywhere you are.
Conclusion
You built a complete IoT pipeline: three sensors into an ESP32, six datastreams into Blynk, and live dashboards on web and phone with historical charts.
If you want to extend it, add more virtual pins for additional sensors such as a wind speed anemometer or a rain sensor.
Credit: The reference build photos and original guide/code are from Instructables by Saiyam.
Want the exact parts used in this build? Grab them from ShillehTek.com. If you want help customizing this project or building something for your product, check out our IoT consulting services.


.png?v=25000753014097803521791168436)

.png?v=68677308723310773341791168436)


